Executive Performance Overview
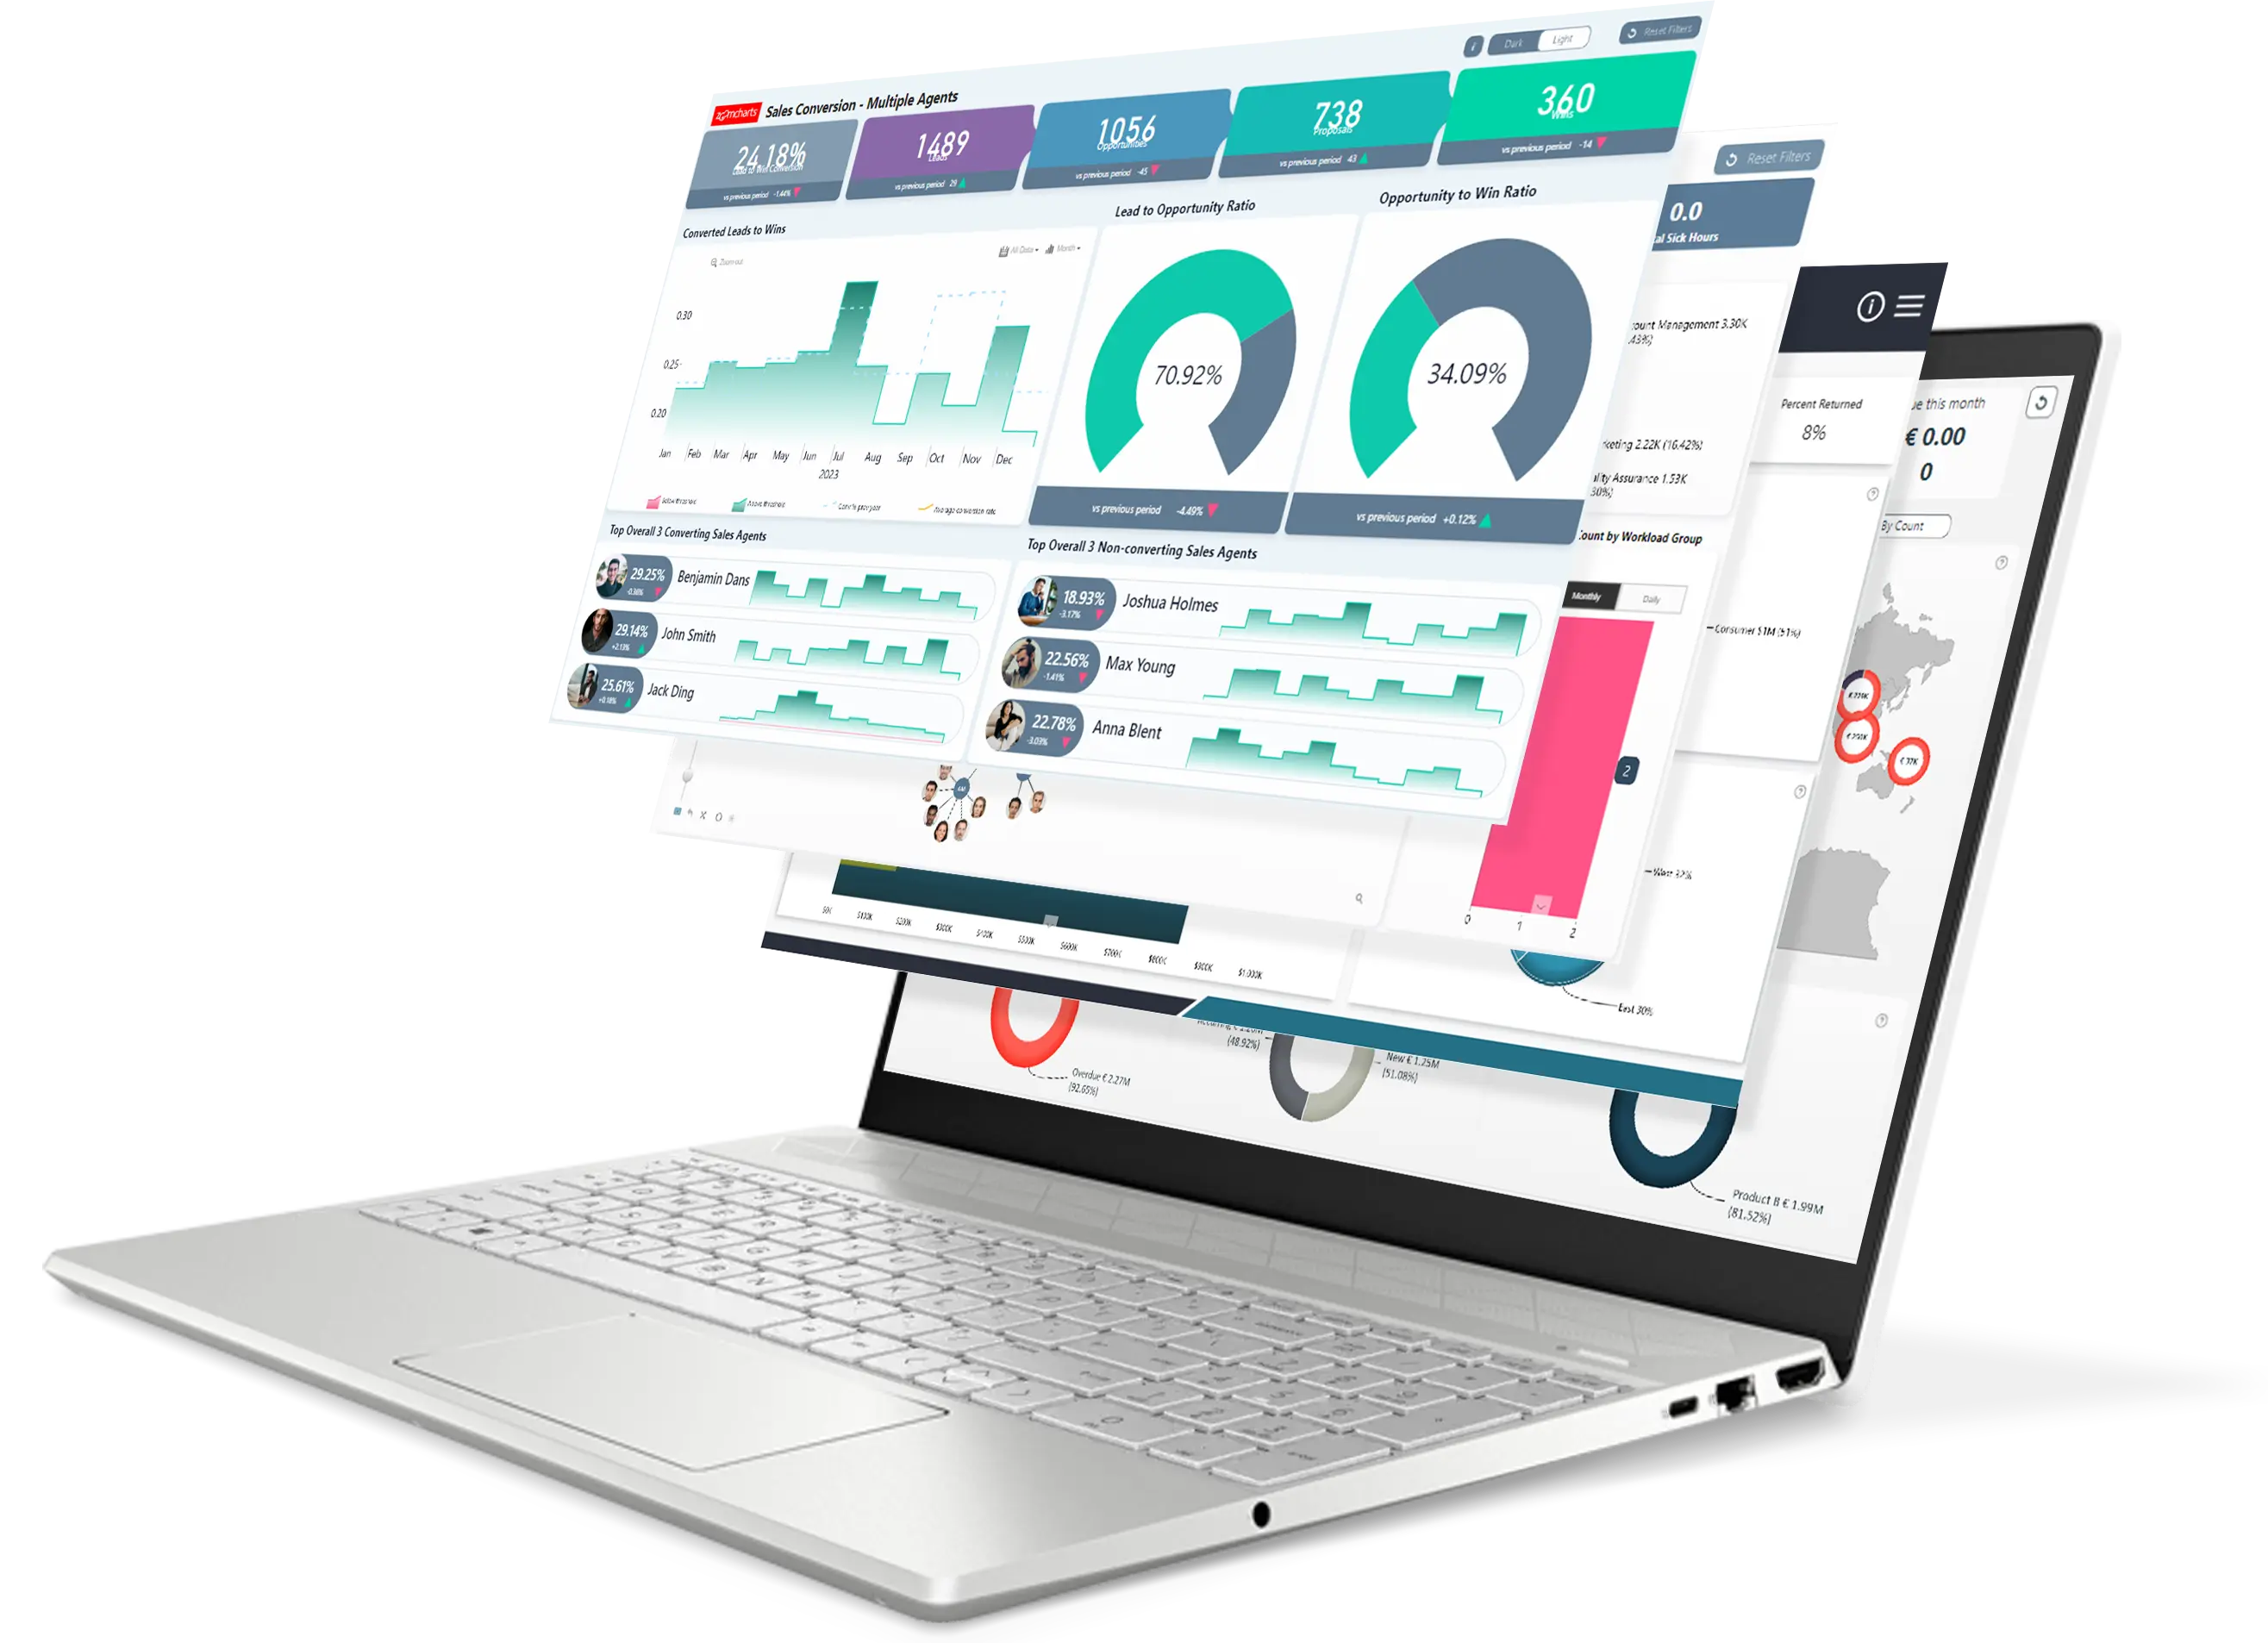
Power BIA decision-focused dashboard built for leadership visibility across KPIs and business trends.
Better Reports. Better Control
Built for clearer visibility, structured reporting, and better day-to-day decisions.
Inspired by reporting workflows used by teams at:
See how PBTS Data Power BI dashboards can benefit your team
Have full control over how your Power BI dashboards look, behave, and guide users through key business insights.
Create reports that people actually enjoy exploring, with clear narratives, visual flow, and meaningful data stories.
Make dashboards easier to use with intuitive navigation, clean layouts, and interactions that support decision-making.
Help users find actionable insights faster by organizing metrics, trends, and performance views around real business questions.
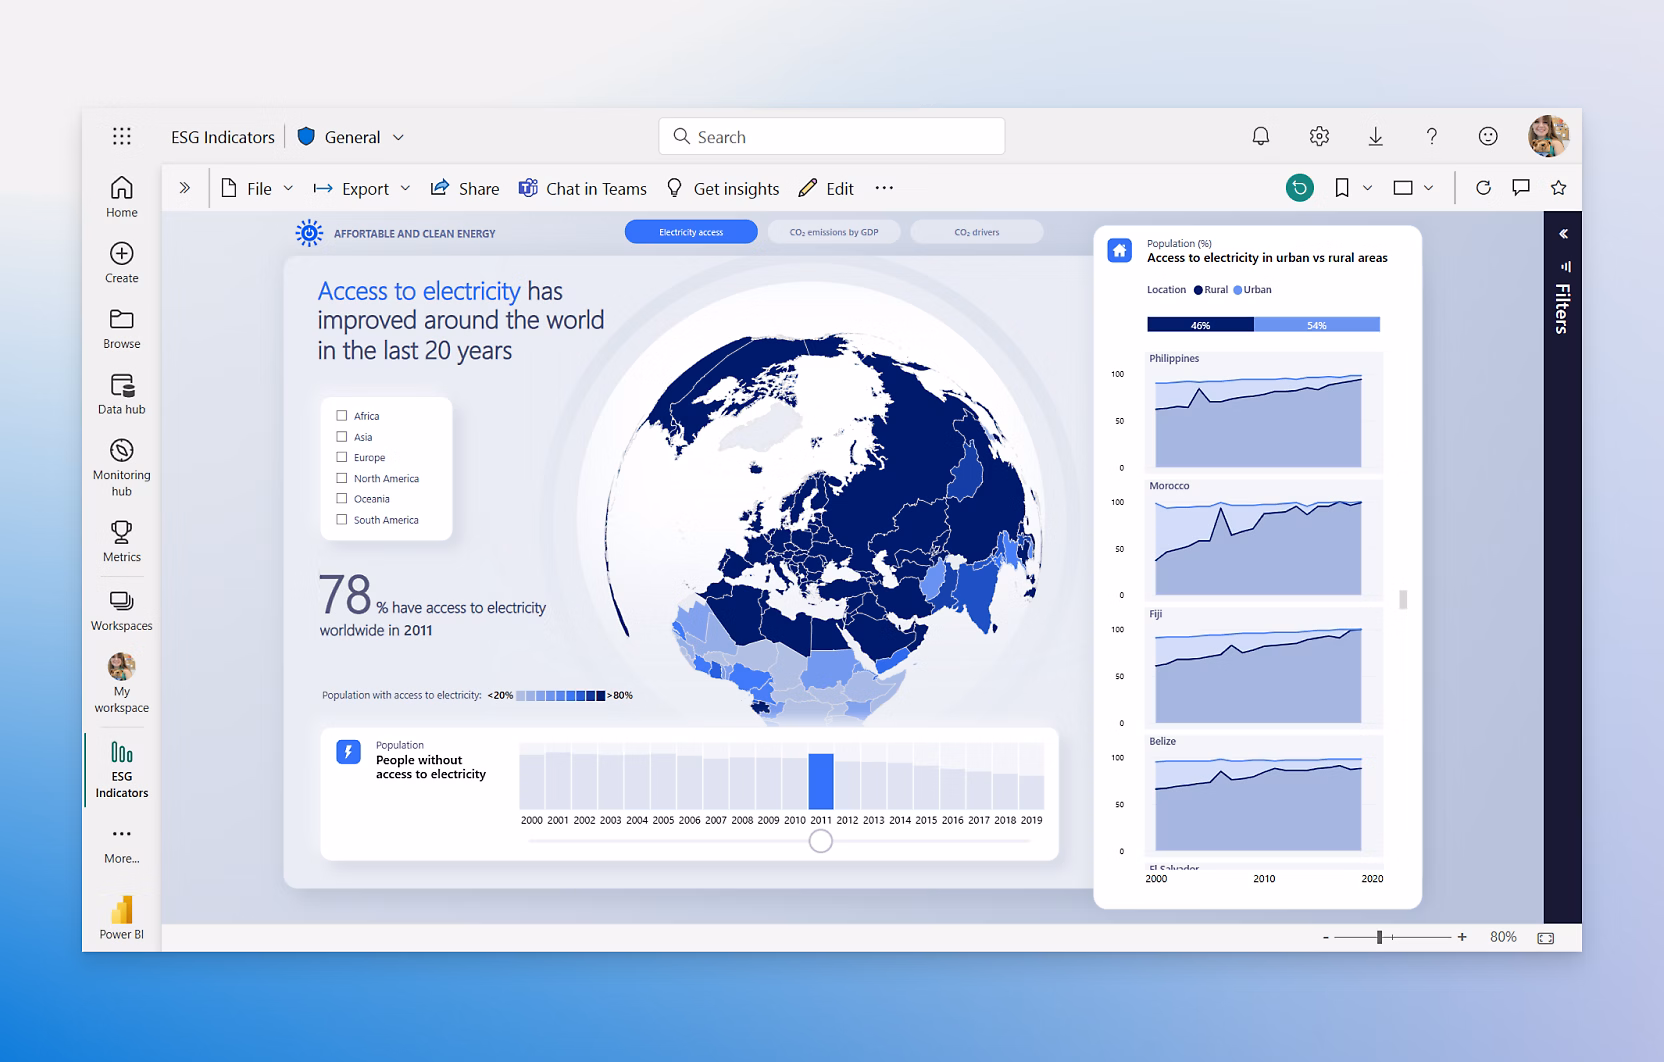
Power BI Showcase
Designed for teams that need reporting they can actually use. These Power BI dashboards transform raw business data into structured reporting, clear KPIs, and faster operational insight.
A decision-focused dashboard built for leadership visibility across KPIs and business trends.
Power BI Capabilities
We design Power BI dashboard experiences that bring the right metrics forward, so teams can track performance clearly and act with more confidence.
We turn scattered updates into structured Power BI reporting views that make trends, gaps, and progress easier to understand.
We improve how reporting data is organized so Power BI dashboards stay clearer, more reliable, and easier to maintain over time.
"We build Power BI reporting dashboards teams can actually use and rely on."
Built for real Power BI workflows
How we work
Effective Power BI reporting requires more than attractive charts. It needs clean data, a reliable model, accurate DAX measures, and dashboards designed around how your team makes decisions.
We focus on data quality, reporting structure, dashboard usability, and performance so your Power BI dashboards are clear, accurate, and practical for daily business use.
We identify your reporting goals, key business users, required KPIs, current data sources, and the decisions your Power BI dashboards need to support.
We clean, transform, and structure your data using Power Query, then design a reliable Power BI data model that supports accurate reporting and scalable analysis.
We create professional Power BI dashboards with clean visuals, useful slicers, KPI cards, DAX measures, drill-through pages, and layouts designed for real business use.
We test report performance, refine visuals, publish to the Power BI Service, configure refresh where needed, and prepare the dashboard for team adoption.
Power BI Reviews
Power BI Projects Reviewed


0.51k
21%Growth in dashboard requests this year
Average Rating
4.9
Based on Power BI dashboard delivery experience
The Power BI dashboard gave us one clear view of revenue, costs, and monthly performance. Reporting meetings are now much easier.
David K.
Finance Manager
2025-04-08
PBTS helped us replace manual Excel reporting with a Power BI dashboard that updates faster and is easier for managers to use.
Amina N.
Operations Lead
2025-05-19
The data model was well structured, the visuals were clean, and the dashboard gave our team better visibility on performance.
Brian T.
Analytics Manager
2025-08-11
The dashboard was practical and polished. It helped us track project delivery, workload, and key risks without chasing spreadsheets.
Linda W.
Project Manager
2025-10-04
Our sales reporting became clearer and more useful. The Power BI dashboard made trends, targets, and gaps much easier to discuss.

Michael S.
Growth Manager
2026-01-22
Ready to improve reporting?
From executive reporting to operational dashboards, we help teams transform raw business data into clearer reporting systems.
Power BI FAQ
Clear answers about Power BI reporting, integrations, dashboards, data structure, and project delivery.